The solution we created simplifies water supply system operations and management, streamlines maintenance procedures, and reduces operational costs.
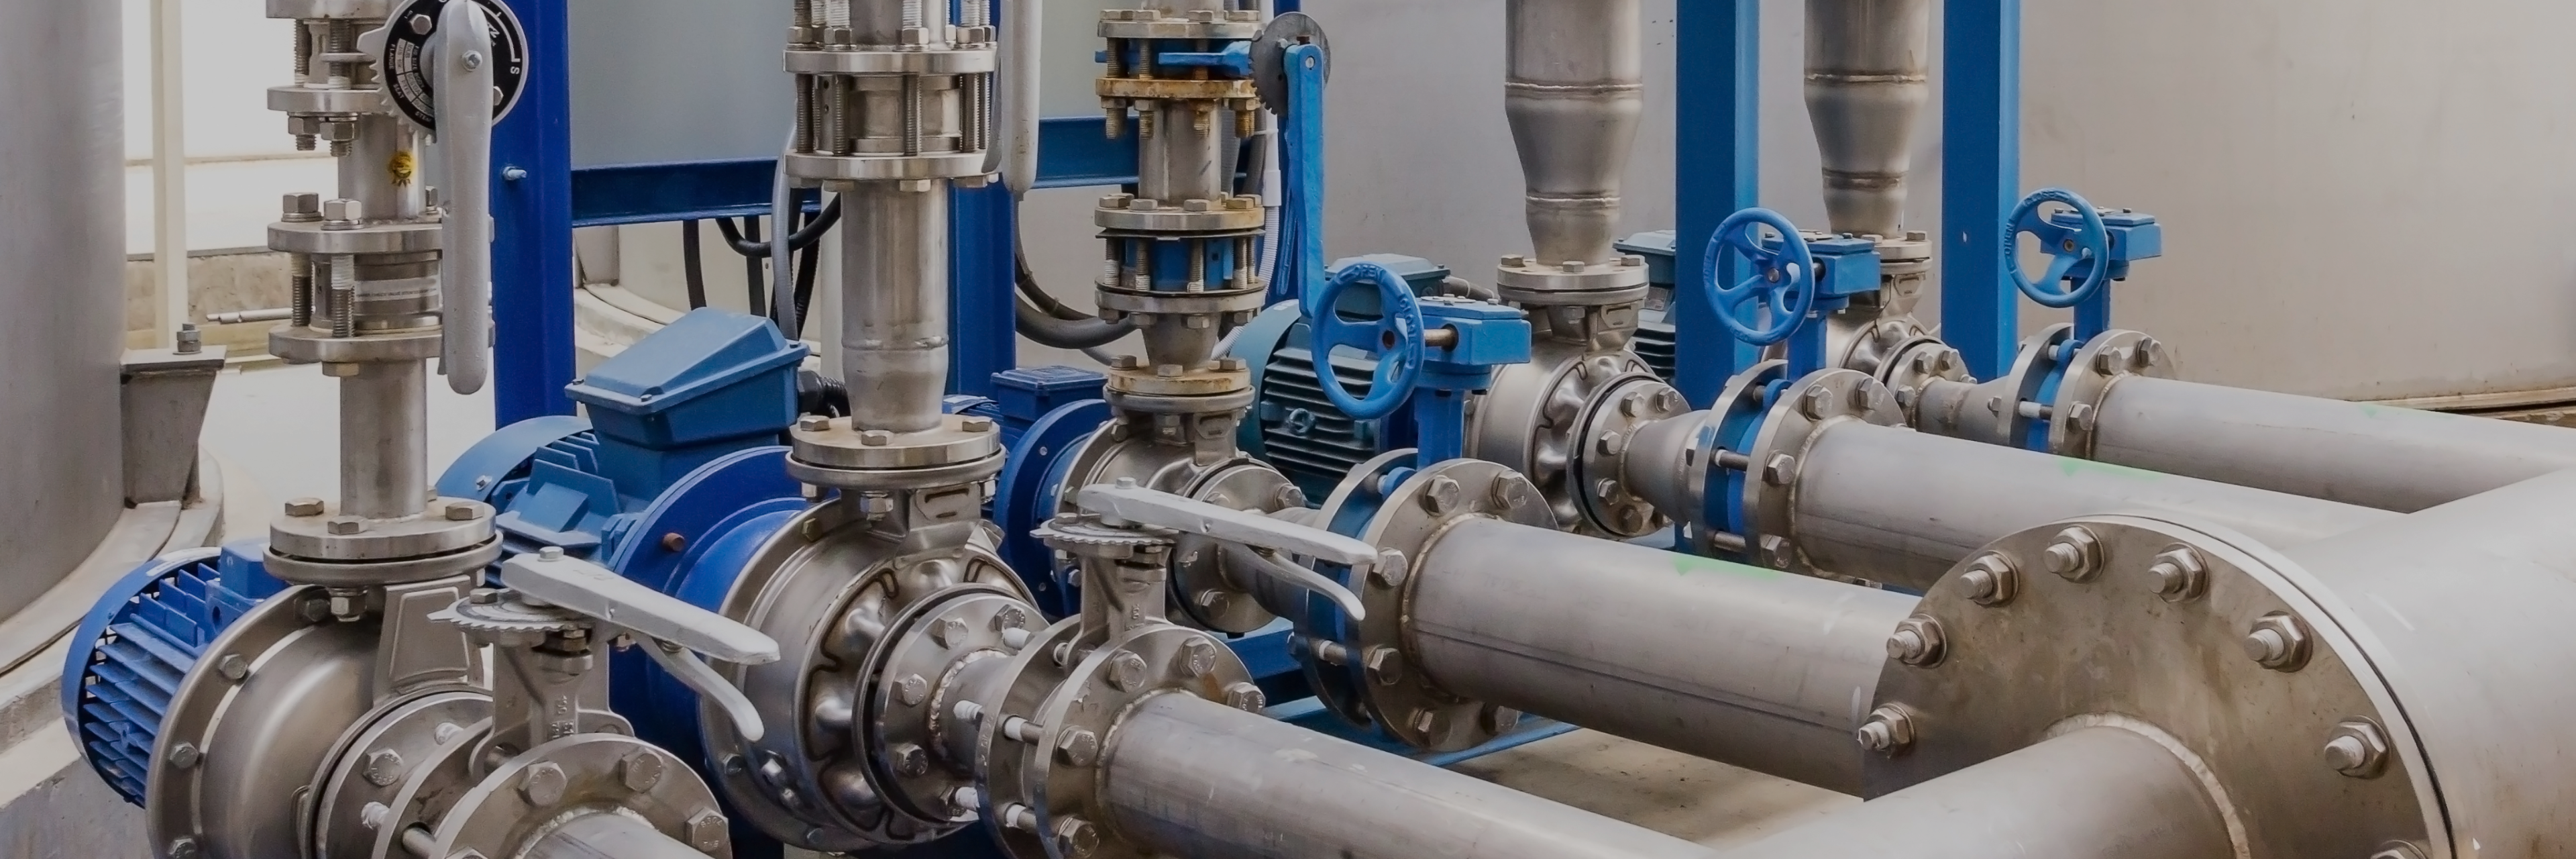
Our client, a globally recognised company, provides world-class engineering, procurement, consulting and construction services. With a presence in 30 countries and operations in over 100 countries across six continents, they are renowned for building sustainable, resilient and adaptable infrastructure. As part of their contribution to effective water stewardship, they have embarked on the development of a water distribution network (WDN) management platform in the UK.

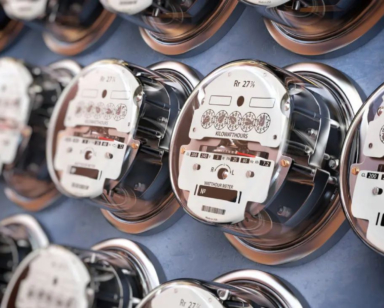
In the UK, the WDN is segmented into supply regions consisting of independently regulated sub-networks – known as District Metered Areas (DMAs) – overseen by different utilities. Strategically placed IoT sensors at high-impact nodes within the network collect key data, which is then stored in databases.
Our client approached EffectiveSoft with only a proof of concept (PoC) for the WDN monitoring dashboard. Although the database was populated with IoT data from the DMAs, there was no system in place to process and visually present this data on a virtual map. Our team worked with the client’s in-house team to overcome this challenge.
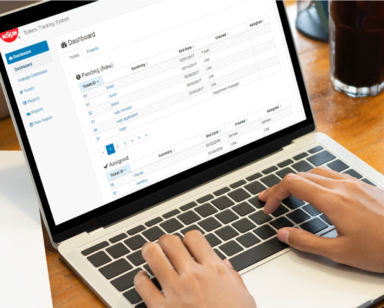
We transformed the client’s PoC into a fully operational dashboard that provides a comprehensive view of water networks for utilities.
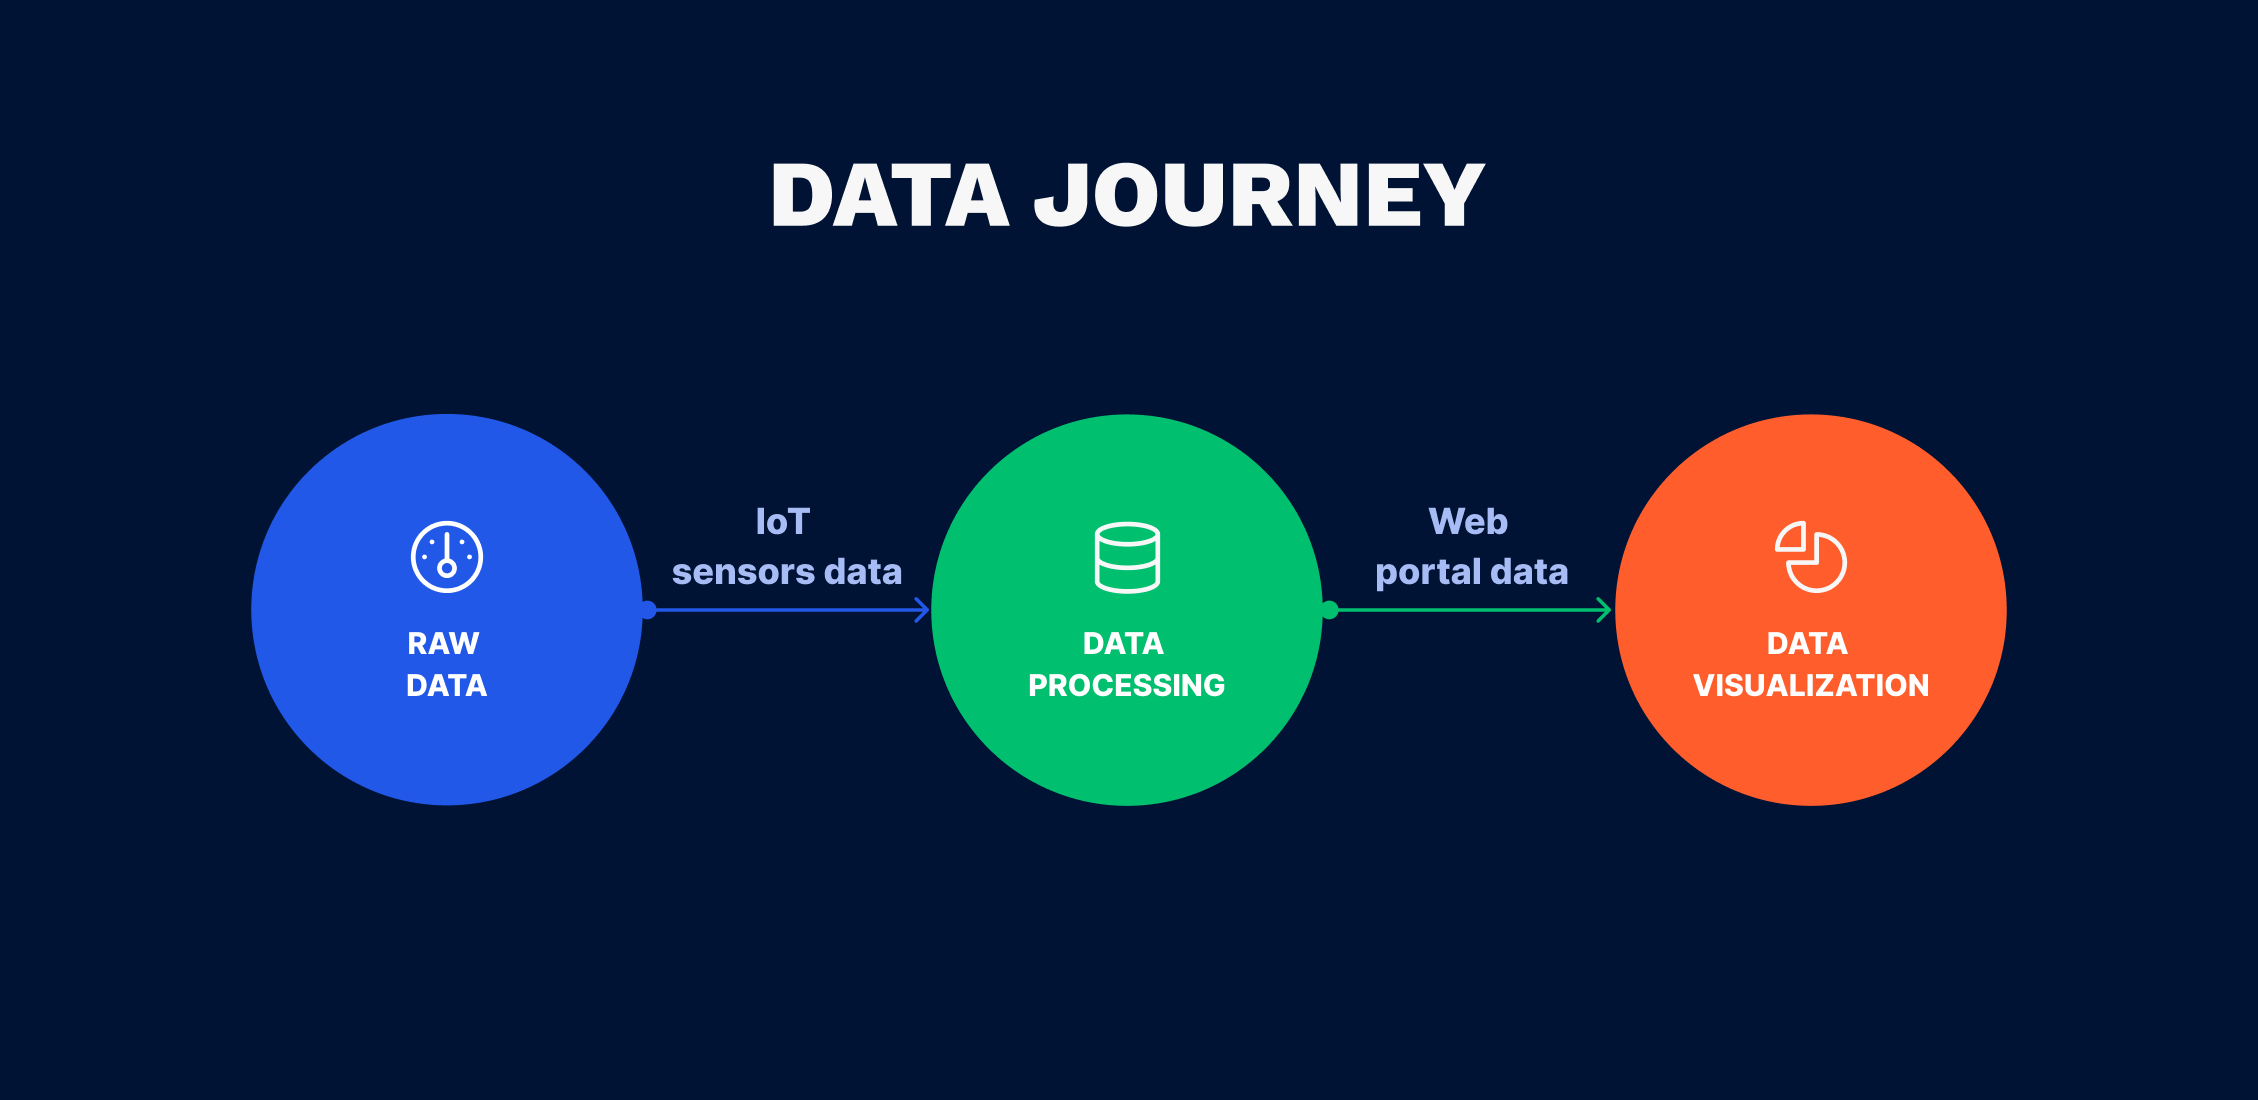
The API we developed consolidates raw IoT data into tables, calculates averages and/or deviations from standard metrics based on data from the sensors. Another API then uses the processed data to determine the RAG status of various DMA assets.
Users can access detailed reports on any asset by selecting it on the map. The IoT dashboard displays data on flow rates, pressure, water leaks, pipe breaks and more. The inclusion of historical data for each asset makes it easier to optimize maintenance and service planning.
Our team would love to hear from you.
Fill out the form to receive a free consultation and explore how we can assist you and your business.
What happens next?